配置PhpStorm调试PHP
第一步:配置 XDebug
下载安装XDebug到本地环境(参考:Zend Studio 9.x + xampp + XDebug 调试环境安装详解),打开php.ini,参考配置如下:
[XDebug]
zend_extension = "D:\PHP\xampp2\php\ext\php_xdebug.dll"
xdebug.profiler_append = 0
xdebug.profiler_enable = 0
xdebug.profiler_enable_trigger = 0
xdebug.profiler_output_dir = "D:\PHP\xampp2\tmp"
xdebug.profiler_output_name = "cachegrind.out.%t-%s"
xdebug.remote_enable = 1
xdebug.remote_handler = "dbgp"
xdebug.remote_host = "127.0.0.1"
xdebug.remote_port=9000
xdebug.trace_output_dir = "D:\PHP\xampp2\tmp"
【注意】
profiler_append、profiler_enable、profiler_enable_trigger 这几个 选项 还是关了吧,不然的话,会在 profiler_output_dir 目录下,产生 几十G 的缓存文件,占磁盘!
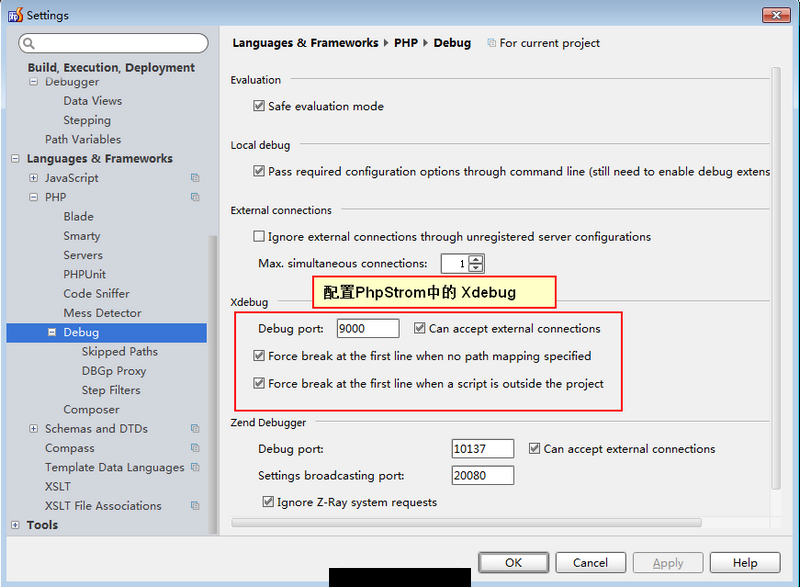
第二步:配置PhpStorm中的 XDebug
路径:File -> Settings -> Languages & Frameworks -> PHP -> Debug
第三步:配置PhpStorm中的 Server
路径:File -> Settings -> Languages & Frameworks -> PHP -> Servers
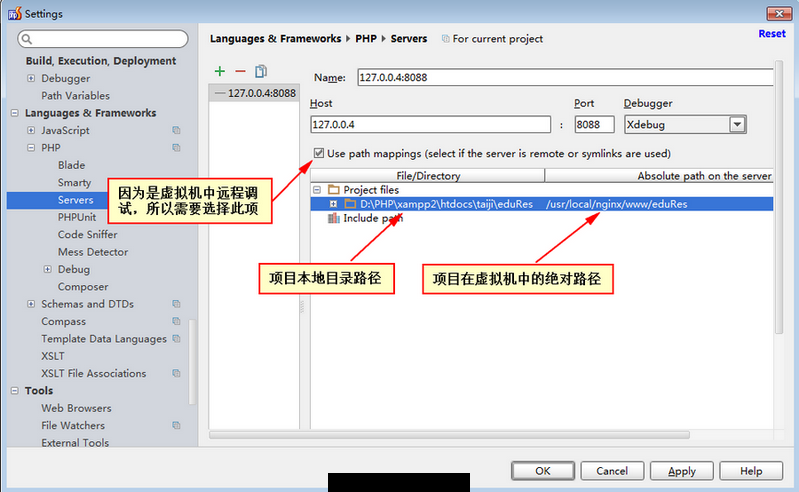
注意:如果所谓的“远程服务器”就在本地的话,就不需要勾选“Use path mappings(select if the servers is remote or symlinks are used)”
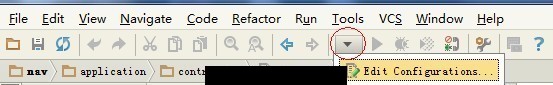
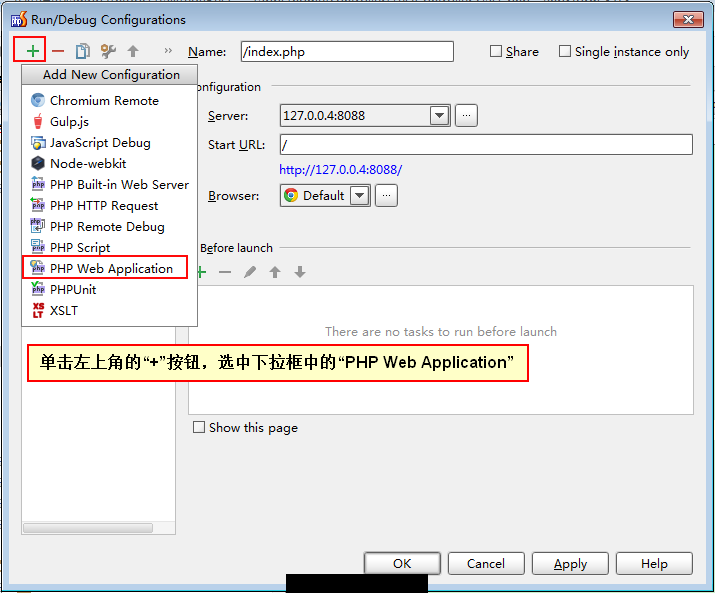
第四步:设置调试项
点击 如下图所示的“下三角”按钮,选择 “Edit Configurations”,弹出“Run/Debug Configrations”对话框:
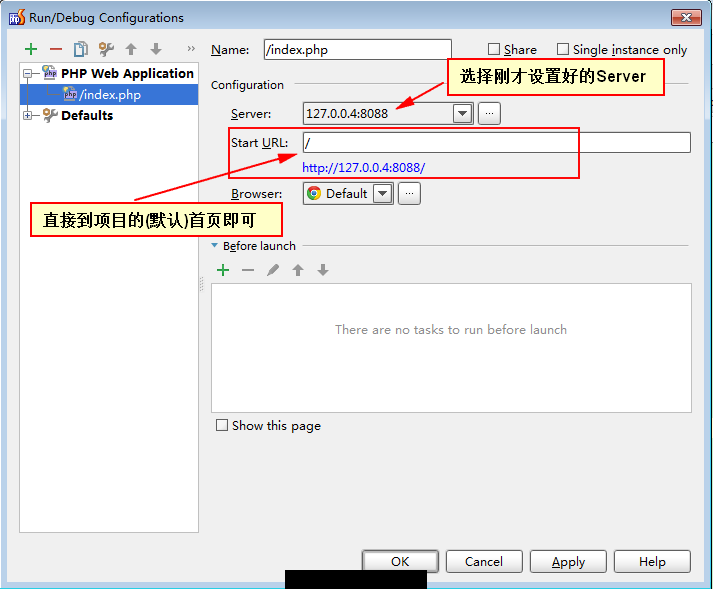
第五步:开始调试页面
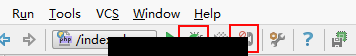
点击工具栏上的“电话按钮”,开启调试端口的监听,然后点击“甲壳虫按钮”,开始调试页面。
特别说明下:因为刚才设置的是:开启调试的时候,打开项目的“首页”,所以当点击“甲壳虫按钮”后,它会打开“首页”。
不用管它打开了“首页”,上面的动作只是为了开启PhpStorm的调试监听功能,当我们在浏览器中输入要调试的页面时(记得按“回车键”),如页面 http://127.0.0.4:8088/home/Test/test,它会自动跳转页面的断点处,如下图所示:
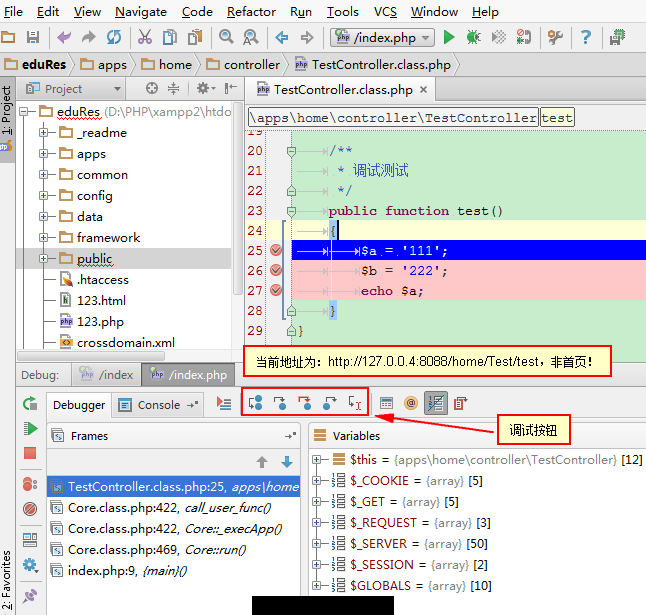
点击调试按钮,一步一步调试吧(快捷键 F5)!
常用的几个快捷键
F5:Step Into
F6:Step Over
F7:Step Out
参考:
https://www.adayinthelifeof.nl/2012/12/20/debugging-remote-cli-with-phpstorm
延伸阅读: